
Best Stock Market Trading Institute in India
Learn proven trading strategies and become the go-to expert for stock market solutions.
Best Stock Market Trading Institute in India
Learn proven trading strategies and become the go-to expert for stock market solutions.
Experience
With the trust of 5000+ Students, we're building futures together
Empowering traders who now lead and excel in these domains


Elevate your Trading Career
Discover your place among professionals from India’s leading financial markets


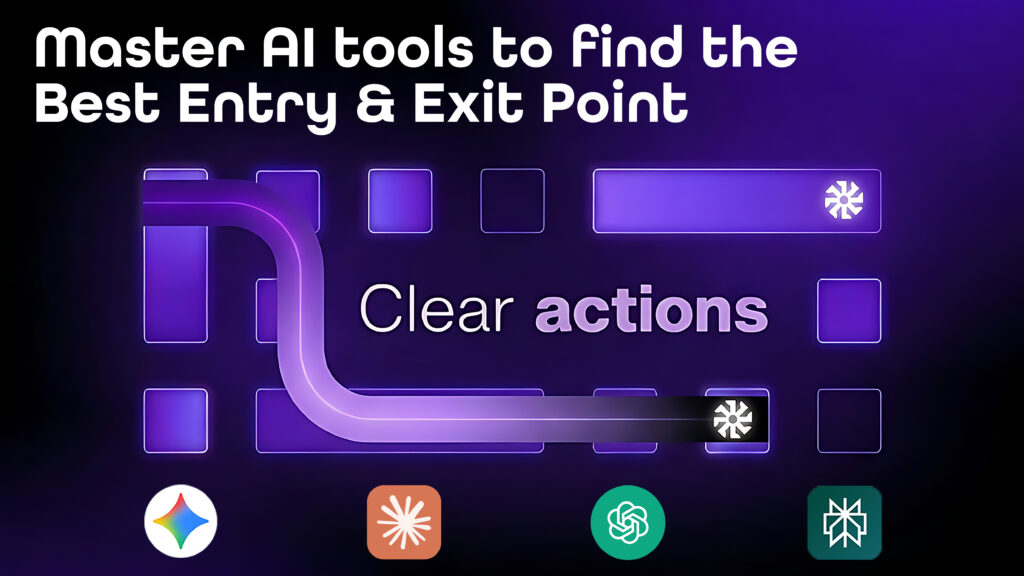


Get Hands-On with India's Top Trading Platforms


The Complete 25 Hours Free Course Series
What 90% of Retail Traders Miss A Free Trading Lecture Series
25 Lessons. One System. The Trader You Were Meant To Be.
25 Hours Free Course Series
What 90% of Retail Traders Miss A Free Trading Lecture Series
25 Lessons. One System. The Trader You Were Meant To Be.
M1 MARKET FOUNDATIONS & TECHNICAL ANALYSIS
M2 SMART MONEY CONCEPTS (SMC)
M3 LIQUIDITY, VOLUME AND ADVANCED DATA
M4 TRADING SYSTEMS & SECTORE ANALYSIS
M5 EARLY MULTIBAGGERS IDENTIFYING
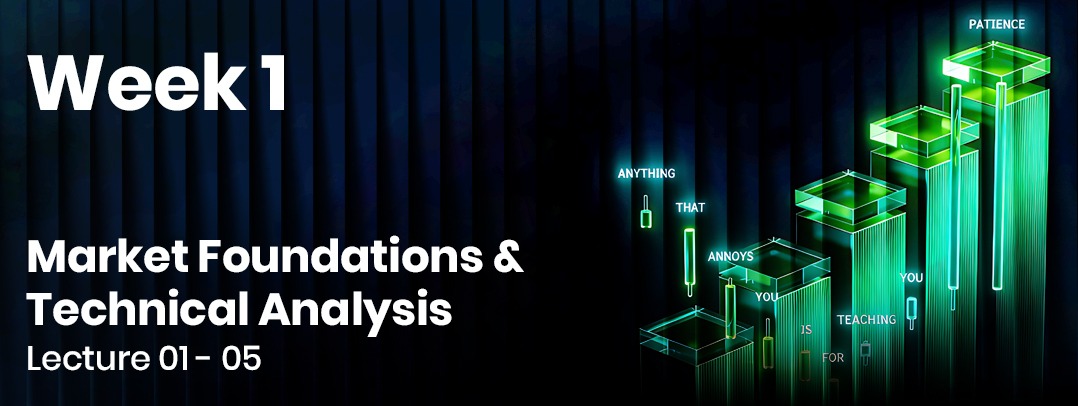
Lecture 01 - How Indian Stock Markets Really Work ?
- Who is on the other side of your trade?
Understanding the roles of market makers, prop desks, and algos in providing liquidity. - What are bid-ask spreads, order book depth, and slippage?
Exploring the mechanics of trade execution and the reality of impact costs. - How does the matching engine function?
A look into price-time priority and how order queues are managed. - What is the difference between Limit, Market, and SL/SL-M orders?
Analyzing how different order types behave during the fill process. - Why is retail structurally last due to co-location and latency?
Understanding the technological advantages institutional players have over retail traders. - What is the role of the Clearing Corporation?
How they act as a central counterparty for every trade. - How do T+1, T+0, and instant settlements work?
Understanding the lifecycle of a trade from execution to settlement. - Why do shares live in NSDL/CDSL demat accounts?
The legal and structural storage of electronic securities. - What are the rules for margins, leverage, and MTF?
Navigating peak margin rules and how to use leverage safely. - How do brokers actually make money?
An inside look at the brokerage business model beyond just commissions. - How do FII and DII flows impact the market?
Tracking the movement of big institutional money. - What are block deals and block deal windows?
Understanding how massive quantities of shares are traded in specific time slots. - What are circuit limits and ASM/GSM categories?
Identifying stocks under surveillance or trading restrictions. - How does the pre-open session handle price discovery?
Determining the opening price before the 9:15 AM bell. - What is included in the friction stack?
Calculating the true cost of trading including STT, stamp duty, GST, and DP charges.
Lecture 02 - Why 90% Read Candlesticks Backwards ?
- What does a candle actually represent?
Viewing a candle as a psychological battle between buyers and sellers. - Why does the close matter more than the wick or color?
Understanding why the final consensus of the day is the most critical data point. - How do you read wicks correctly?
Distinguishing between price rejection and order absorption. - What does body size indicate?
Using the spread of the candle to measure conviction and momentum. - Why is a bullish pattern in the wrong place actually bearish?
Learning that location on the chart matters more than the pattern itself. - What is the importance of context over pattern?
Why a Doji at support means something entirely different than a Doji at resistance. - How do you avoid misidentifying hammers and shooting stars?
Correcting common retail mistakes in candle identification. - What is the relationship between engulfing patterns and volume?
Validating high-conviction moves using the prior trend and volume data. - Why is a single candle meaningless alone?
Realizing that one candle is just a single data point in a larger story. - How do candles “lie” without volume?
Identifying price moves that lack institutional participation. - What is timeframe deception?
Avoiding the traps of looking at small-scale price action without a macro view. - How do you read 3–4 candle sequences as the real signal?
Combining candles to understand the immediate flow of the market. - How does smart money exploit predictable candle reactions?
Understanding how retail “textbook” patterns are used as traps.
Lecture 03 - The Multi-Timeframe Secret ?
- Why does one timeframe give you a blind spot?
Understanding the danger of missing the “big picture”. - What is the top-down approach?
Moving from Higher Timeframe (HTF) bias to Lower Timeframe (LTF) entry. - How do you choose your three timeframes?
Applying the 4x–6x rule to keep your analysis consistent. - How does HTF trend override LTF signals?
Why you should never trade against the major trend based on a minor signal. - How do you align structure across timeframes?
Finding confluence where multiple timeframes tell the same story. - Why is your entry timeframe not your decision timeframe?
Separating the “Where” from the “When” in trading. - How do you resolve the “fractal disagreement” problem?
Knowing what to do when different timeframes contradict each other. - How do you read HTF support/resistance on the LTF?
Executing precision trades within larger zones. - How do you avoid overtrading caused by LTF noise?
Filtering out insignificant price fluctuations. - How do you match timeframe with trade duration?
Aligning your setup with whether you are a scalper, intraday, or swing trader. - What are common multi-timeframe mistakes?
Identifying the errors that kill trades before they even start. - What should be on a repeatable multi-timeframe checklist?
A step-by-step process for every trade entry.
Lecture 04 - The Maths of Not Losing ?
- Why does capital preservation come before profit?
Understanding that staying in the game is the first rule of trading. - What is the 1–2% rule for risk per trade?
Defining the maximum amount of capital you can lose on a single bet. - How do you calculate position sizing?
Using the formula (Risk ÷ Stop Distance) to determine how much to buy. - What are risk-to-reward (R:R) ratios?
Setting a minimum standard for the potential gain relative to the risk. - What is the relationship between win rate and R:R?
Understanding how you can be “wrong” often and still be profitable. - Why is the math of drawdowns so brutal?
Realizing why a 50% loss requires a 100% gain just to break even. - What is the expectancy formula?
Defining the mathematical “edge” of your trading system. - What are risk of ruin and consecutive losses?
How to survive a “losing streak” without blowing up your account. - How does compounding compare to fixed-lot sizing?
Choosing the best method for long-term account growth. - Why does averaging down destroy accounts?
The mathematical danger of adding to a losing position. - What is correlation risk?
Avoiding the mistake of taking multiple trades that are actually the same bet. - Why set daily/weekly max-loss limits?
Creating “circuit breakers” for your own trading behavior. - Why does sample size matter?
Understanding why you can’t judge a strategy based on just 10 trades.
Lecture 05 - Trend Identification Framework ?
- What is a trend actually?
Defining trends objectively through Higher Highs/Lows and Lower Highs/Lows. - What are the three trend states?
Identifying if the market is trending up, trending down, or in a range. - Why is market structure the only objective trend tool?
Moving away from subjective lines and indicators. - How do you define swing highs and swing lows correctly?
Identifying the true pivot points of market structure. - Which timeframe determines the bias?
Answering the question of which trend actually matters for your trade. - How do you distinguish a pullback from a reversal?
Recognizing the difference between a temporary dip and a trend change. - How do you identify a range?
Understanding why most markets are ranging and how to spot it early. - What is trend strength?
Comparing impulsive moves to corrective moves to measure momentum. - How do you use structure instead of indicators?
Trusting price action over lagging technical tools. - When should you stay out?
Identifying trend transition zones where the direction is unclear. - What is a trend transition zone?
Spotting the shift from one trend state to another. - What is a repeatable trend-reading routine?
A daily habit for objective market analysis.
Lecture 06 - CHoCH Explained ?
- What is a Change of Character (CHoCH)?
Identifying the very first sign of a potential trend reversal. - What is the critical difference between CHoCH and BOS?
Distinguishing between trend reversal and trend continuation. - How do structure breaks signal a shift in control?
Seeing the moment buyers lose power to sellers (or vice versa). - What is internal vs. external structure?
Understanding minor shifts within a larger structural framework. - How do you identify the last valid swing point?
Finding the “line in the sand” that confirms a CHoCH. - Why do most traders confuse pullbacks for CHoCH?
Avoiding the trap of early entries on minor retracements. - What is the importance of HTF vs. LTF CHoCH?
Assessing the reliability of a reversal based on timeframe. - How do you combine CHoCH with liquidity?
Using stop-hunts as confirmation for a high-probability reversal. - What are entry techniques after a confirmed CHoCH?
How to execute a trade once the character change is valid. - How do you filter out a false CHoCH?
Identifying “fakeouts” designed to trap early reversal traders. - What is the CHoCH + FVG/Order Block confluence?
Combining structure with supply/demand for a precision entry. - What do real chart examples of early reversal detection look like?
Seeing the theory applied to historical price action.
Lecture 07 - BOS Trading ?
- What does Break of Structure (BOS) mean?
Confirming that the current trend is healthy and continuing. - How is BOS used for trend confirmation?
Using structural breaks to justify staying with the trend. - How do you identify valid vs. invalid breaks?
Learning what constitutes a “real” break (close vs. wick). - Why does chasing the breakout usually fail?
Understanding the dangers of “buying high” during a BOS. - Why should you wait for the pullback after BOS?
Improving your risk-reward by entering after the impulse. - How do you use BOS + Order Block entries?
Entering at the source of the structural break. - What is a displacement candle?
Identifying the high-momentum candle that confirms a BOS. - Where should you place stops on continuation trades?
Using structural lows/highs to protect your capital. - How does BOS work across timeframes?
Aligning the “echoes” of structure from HTF to LTF. - Is there liquidity behind BOS levels?
Understanding that many BOS levels act as “magnets” for price. - How do you manage a continuation trade?
Knowing when to hold and when to take profit. - When does a continuation die?
Identifying BOS failure as an early warning of a range or reversal.
Lecture 08 - Fractal Markets ?
- What does fractal market structure mean?
Understanding that price action patterns repeat at every scale. - How can a 1-min CHoCH precede a daily shift?
Seeing how macro changes start at the micro level. - What is the relationship between micro and macro structure?
Learning how small waves build into large trends. - What is “nesting” in structure?
Finding LTF setups hidden inside HTF supply/demand zones. - How do you use LTF for early warnings of HTF reversals?
Using the “magnifying glass” of lower timeframes. - Why do fractals justify multi-timeframe analysis?
The scientific reason why looking at multiple charts is necessary. - How do you avoid the trap of over-reading the 1-min?
Learning when the 1-min is signal and when it is just noise. - How do you align fractal structure for high-probability entries?
The “Perfect Alignment” setup across all scales. - What is a practical fractal entry framework?
A step-by-step model for executing trades using fractals.
Lecture 09 - The Physics of a Candle ?
- What does a large-range candle reveal about order flow?
Identifying the footprints of institutional intent. - What is displacement?
Recognizing the signature of big money entering the market. - Why do big candles create Fair Value Gaps (FVGs)?
Understanding the imbalance left behind by rapid moves. - Why are candles like magnets?
Understanding why price often returns to the origin of a big move. - What is the difference between momentum and exhaustion candles?
Telling the difference between a strong start and a desperate end. - How do you read open/close positioning within a large candle?
Measuring the internal strength of a single bar. - What is the role of volume behind range expansion?
Confirming the validity of a large-range candle. - Are there trapped traders inside big candles?
Understanding the liquidity created by rapid price expansion. - Why does price revert to the candle’s midpoint?
Using the 50% level as a key area of interest. - How do you use large candles to mark key levels?
Identifying supply/demand zones based on range expansion. - How do you trade the retest of a displacement candle?
Finding high R:R entries after the initial surge.
Lecture 10 - Fair Value Gaps (FVG) ?
- What is an FVG (Imbalance) actually?
Defining the market inefficiency where only one side of the market was active. - What is the three-candle structure that forms a gap?
The mechanical way to identify an FVG on a chart. - Why does imbalance get “filled”?
The logic of price returning to seek balance and liquidity. - What are bullish vs. bearish FVGs?
Identifying buy-side and sell-side imbalances. - How do you use FVG as an entry zone vs. a target?
Using gaps for both entering trades and setting TPs. - What is the 50% (consequent encroachment) level?
Why the midpoint of a gap is a high-sensitivity area. - What makes a high-probability vs. low-probability gap?
Filtering which imbalances are likely to hold. - How do you find FVG + market structure confluence?
Combining gaps with BOS/CHoCH for better trades. - What are inversion FVGs?
Understanding what happens when a gap is breached and flips its role. - Which gaps don’t get filled and why?
Identifying runaway gaps that signal extreme strength. - Where should stops and targets be placed around FVGs?
Managing risk when trading imbalances. - What are some real FVG examples on Indian indices?
Seeing imbalances play out on Nifty and Bank Nifty.
Lecture 11 - Why Your Trendline Broke ?
- Why are retail trendlines so obvious and exploited?
Understanding that trendlines are visual liquidity for institutions. - How do institutions see your trendline as liquidity?
The logic behind stop-hunts at popular diagonal levels. - What is a trendline liquidity sweep?
Identifying the fakeout that happens right before the real move. - Why do “valid breakouts” often reverse instantly?
Recognizing the trap set for retail breakout traders. - Subjective trendlines vs. objective structure?
Choosing the reliability of horizontal levels over diagonal ones. - What is the stop-hunt below trendline support?
Seeing where the “smart money” enters by taking retail stops. - How do you replace trendlines with structural levels?
Building a more robust analysis framework. - What is diagonal vs. horizontal liquidity?
Understanding different types of liquidity pools on a chart. - How do you use the trendline trap to your advantage?
Learning to trade with the institutions rather than against them. - What confirmation do you need before trusting a break?
Filtering out low-quality structural shifts. - What do engineered trendline breaks look like?
Identifying artificial price moves designed to generate liquidity.
Lecture 12 - Smart Money Zones ?
- What are order blocks actually?
Identifying the specific candles where big institutions placed their orders. - How do institutions accumulate and distribute?
Understanding the lifecycle of institutional positioning. - How do you identify a valid order block?
Distinguishing between high-quality zones and random candles. - What are mitigation vs. breaker blocks?
Understanding how “failed” zones flip and become new areas of interest. - How does retail S/R differ from SM zones?
Comparing traditional support/resistance with institutional order flow. - Where are the liquidity pools?
Identifying the hidden “piles of money” above highs and below lows. - What are stop hunts and liquidity grabs?
The mechanism of price moving specifically to trigger orders. - What is the accumulation–manipulation–distribution (AMD) cycle?
The daily architectural pattern of the market. - What is the order block + FVG + liquidity confluence?
The “holy trinity” of high-probability setups. - How do you refine zones on lower timeframes?
Drilling down to find the tightest possible entry. - How do you set entry, stop, and target around SM zones?
Practical execution rules for SMC trading.
Lecture 13 - Volume Profile & POC ?
- What is the difference between volume profile and traditional volume?
Understanding volume at price vs. volume over time. - What is the Point of Control (POC)?
Identifying the “fairest” price where most trading occurred. - What are Value Area High/Low and the 70% rule?
Defining the range where the majority of business is done. - What are High Volume Nodes vs. Low Volume Nodes?
Identifying areas of price acceptance vs. price rejection. - How do LVNs act as fast-move zones?
Understanding why price “slices” through certain areas. - Why is the POC a support/resistance magnet?
The psychological draw of the high-volume level. - What is a Naked/Virgin POC?
Identifying old high-volume levels that price hasn’t revisited. - How do you use volume profile for ranges vs. trends?
Adapting your volume analysis to the market state. - Session vs. composite profiles?
Comparing daily volume data to long-term structural volume. - How do you combine POC with market structure?
Merging price action with volume validation. - Where is big money positioned right now?
Learning to read institutional positioning through volume.
Lecture 14 - Gap Theory in Indian Equity ?
- What are the different types of gaps?
Identifying common, breakaway, runaway, and exhaustion gaps. - Why do Indian equities gap so often?
The impact of overnight global cues and news on local stocks. - What is gap-up vs. gap-down behavior?
Predicting the likely direction of the day based on the open. - What are the statistics on gap fills?
Understanding how often gaps actually get closed. - How do gaps form in the pre-open session?
The mechanics of the first 15 minutes of the Indian market. - What are gap-and-go vs. gap-and-fade setups?
Deciding whether to trade with the gap or against it. - How do you trade the first 15–30 minutes after a gap?
Using the opening price action to set your bias. - What is the logic for entry and stop on a gap fill?
Executing trades based on the filling of an overnight void. - Why do some gaps never fill?
Identifying runaway gaps that lead to massive trends. - Index gaps vs. single-stock gaps?
Understanding the different dynamics of Nifty vs. individual companies. - How do you manage risk around volatile opens?
Surmounting the chaos of the 9:15 AM bell. - What is on a repeatable gap-trading checklist?
The steps to take every morning before the open.
Lecture 15 - F&O Data Decoded ?
- What does Open Interest (OI) actually tell you?
Measuring the total number of active contracts in the market. - What are the different OI buildup types?
Identifying long/short buildup, unwinding, and covering. - What do price + OI combinations mean?
Deciphering the underlying strength or weakness of a move. - Change in OI vs. Total OI?
Focusing on current day’s positioning versus long-term sentiment. - How do you read support/resistance from the option chain?
Using OI to find the “walls” in the market. - What is Max Pain theory?
Predicting where the index might close to cause the most loss to buyers. - What is the Put-Call Ratio (PCR)?
Using sentiment data to identify overbought or oversold extremes. - How does IV signal market expectations?
Understanding the relationship between volatility and fear. - What are FII/DII derivative positions?
Tracking what the “big boys” are doing in the F&O segment. - What is the Long-Short ratio?
Measuring the positioning of different participants (Retail vs. Pro). - How do you read where players are positioned before expiry?
Preparing for the volatility of settlement day. - How do you combine F&O data with price action?
Using data to validate what you see on the chart.
Lecture 16 - Options Basics for Price Action Traders ?
- What are the core mechanics of calls and puts?
A simple foundation for understanding options contracts. - What is intrinsic vs. time value?
Breaking down the components of an option’s price. - Which Greeks matter most?
A simple explanation of Delta, Theta, and Vega. - Why do option buyers usually lose?
Understanding the “silent killer” known as theta decay. - ITM, ATM, or OTM: which should you trade?
Choosing the right strike based on your directional bias. - How does IV crush destroy buyers?
Learning why an option price can fall even if the stock moves your way. - How do you select strikes for directional trades?
Finding the best risk-reward balance in the option chain. - Why does expiry selection matter?
Choosing between weekly and monthly contracts for your strategy. - Spreads vs. naked options?
Using multi-leg strategies to control your risk. - How does price action improve option timing?
Using the chart to enter options when momentum is highest. - How do you manage position sizing in options?
Adjusting for the high leverage of derivative contracts. - What are common beginner option mistakes?
Identifying the traps that blow up new options accounts.
Lecture 17 - Sector Rotation in Indian Markets ?
- What is sector rotation and why does it happen?
Understanding how capital moves through different industries. - How do economic cycles drive sector leadership?
Identifying which sectors thrive in different market conditions. - How do you read relative strength between sectors?
Finding the “alpha” by comparing one sector index to another. - Which sectoral indices should you track?
Monitoring Bank, IT, Auto, FMCG, Pharma, etc.. - How does smart money rotate capital?
Seeing the footprints of institutions moving from defensive to cyclical. - What is a leading vs. a lagging sector?
Identifying where the next big move is likely to come from. - What is the top-down flow?
Moving from Index to Sector to specific Stock. - How do you use relative strength to pick stocks?
Buying the strongest stocks in the strongest sectors. - What is defensive vs. cyclical rotation?
Understanding risk-on and risk-off behavior in the market. - What tools and ratio charts are best for rotation?
Using technical tools to visualize money flow. - How do you align trades with the leading sector?
Increasing your odds by trading with the market tide.
Lecture 18 - Delete RSI : What Actually Works ?
- Why do retail traders misuse RSI?
Debunking the “overbought = sell” myth. - What is the lagging nature of oscillators?
Understanding why mathematical indicators are always behind price. - How do you use moving averages correctly?
Choosing the right type and period for your style. - How do MAs act as dynamic support/resistance?
Using averages as “moving floors and ceilings”. - How do you use MA slope as trend confirmation?
Measuring the health of a trend by its angle. - MA crossover myth vs. practical use?
Identifying when crossovers are actually useful signals. - What is real divergence?
Distinguishing regular from hidden divergence. - Why does divergence need structure to work?
Avoiding the trap of trading indicators without price action. - How do you combine MAs with price action?
Using indicators only as a secondary confirmation. - What does a clean, minimal indicator setup look like?
Reducing chart clutter to focus on what matters.
Lecture 19 - The Fibonacci Secret (OTE) ?
- What does Fibonacci retracement actually measure?
Finding the “discount” area in a trending market. - What are the key OTE levels?
Focusing on 0.62, 0.705, and 0.79. - Why does OTE give high R:R entries?
Entering at the extremes of a pullback for tight stops. - How do you draw fibs correctly?
Selecting the correct swing high and low for accurate levels. - What is the fib + order block + FVG confluence?
Combining Fibonacci with SMC for powerful entries. - What is premium vs. discount pricing?
Using the 50% line to avoid buying expensive and selling cheap. - How do you use extensions for targets?
Predicting where a move will end using Fibonacci math. - Why do most retail traders draw fibs wrong?
Correcting common mistakes in swing selection. - How do you use OTE in trend continuation?
Finding your way into an existing trend. - Where should stops and targets be using fibs?
Applying mechanical rules to Fibonacci trading.
Lecture 20 - Swing Trading System ?
- What is swing trading and the ideal holding period?
Defining a style that captures multi-day moves. - Which timeframes are best for swing setups?
Choosing your charts for analysis and execution. - How do you build a swing trading watchlist?
Selecting stocks that have the potential for large moves. - What are the entry criteria for a swing trade?
Looking for the perfect confluence of structure and level. - Where do you place stops for multi-day holds?
Protecting yourself against overnight volatility. - How do you manage position sizing for swings?
Calculating risk for longer-term trades. - How do you manage overnight and gap risk?
Dealing with the uncertainty of the market close. - What is the profit target and trailing logic?
Knowing when to take money off the table and when to ride. - Why journal your swing trades?
Learning from your holding periods and emotional state. - What is “portfolio heat”?
Managing the total risk of all your open positions. - How do you backtest a swing system?
Proving the strategy works before risking real money. - What is on a complete rules-based swing checklist?
The final step before clicking “buy”.

Lecture 21 - Identifying Multibaggers Early ?
- What makes a multibagger?
Identifying the core drivers behind 10x stocks. - How do you read earnings growth and scalability?
Looking for companies that can grow their profits exponentially. - How do you read fundamentals simply?
Focusing on ROE, debt, margins, and cash flow. - What are sector tailwinds and TAM?
Understanding the “Total Addressable Market” and industry growth. - How do you assess management quality?
Looking at promoter holding and corporate governance. - What are the technical signs of early accumulation?
Spotting big money entering a stock before the breakout. - How do volume and structure breakouts signal a move?
Finding the launchpad for a multibagger. - Small-cap vs. mid-cap risk?
Choosing the right category for exponential growth. - How do you pay the right price (valuation)?
Avoiding the trap of buying overhyped stocks. - What is the early-entry framework?
Combining fundamental conviction with technical timing. - How much patience and sizing is needed?
Learning how to hold a winner for the long term. - What red flags disqualify a stock?
Identifying the warning signs of a failing company.
Lecture 22 - Advanced Trade Management ?
- Why does management matter more than entry?
Realizing that the trade really begins after you are in. - When should you move stops to breakeven?
Knowing when to take the risk off the table. - How do you scale out with partial profits?
Paying yourself while letting the rest run. - What are trailing stop methods?
Using structure, ATR, or MAs to follow the trend. - How do you let winners run vs. cutting early?
Overcoming the urge to take small profits too soon. - What is pyramiding safely?
Adding to your winning positions to maximize gains. - How do you manage trades through news?
Dealing with volatility events while in a position. - What are time-based exits?
Knowing when to leave a trade that is doing nothing. - How do you avoid exiting due to noise?
Staying disciplined when the market fluctuates. - What is the math of asymmetric exits?
Designing exit rules that favor large wins and small losses. - Why pre-define the full plan before entry?
Eliminating decision-making stress during the trade.
Lecture 23 - Trading Psychology Deep Dive ?
- Why is the enemy your own brain?
Understanding the evolutionary biases that make trading hard. - How do fear and greed impact decisions?
Recognizing the physical sensations of emotion in trading. - What are FOMO and revenge trading?
Avoiding the two biggest account killers. - What is loss aversion?
Understanding why humans hate losing more than they love winning. - How do you handle overconfidence?
Staying grounded after a winning streak. - Discipline vs. motivation?
Why routines are more important than “feeling” ready. - How do you detach from a single trade?
Thinking in terms of probabilities, not outcomes. - How do rules bypass emotion?
Using mechanical systems to do the thinking for you. - How do you handle drawdowns mentally?
Staying calm when the system is in a losing phase. - What is the role of patience and boredom?
Realizing that professional trading is often about waiting. - How does journaling build self-awareness?
Tracking your mistakes to improve your mindset. - What routines build emotional control?
Preparing your mind for the trading day.
Lecture 24 - The Professional Trading Plan ?
- Why does a written plan separate pros from gamblers?
Making your strategy concrete and non-negotiable. - How do you define your market and instruments?
Deciding exactly what you will (and won’t) trade. - What is your edge?
Clearly stating why you should make money over time. - What are your risk rules?
Setting hard limits for trades, days, and weeks. - What is on a pre-market routine checklist?
The work you do before 9:15 AM. - What are the during-market discipline rules?
Controlling your behavior while the candles are moving. - What is the post-market review process?
Learning from the day’s successes and failures. - How do you prepare a watchlist?
Organizing your focus for the next session. - What is a trade journaling template?
The data points you must record for every trade. - Which performance metrics should you track?
Monitoring your progress beyond just P&L. - When should you stop trading?
Defining the conditions for taking a break. - How does a daily checklist enforce consistency?
Ensuring you do the same right things every day.
Lecture 25 - Your First 90 Days ?
- How do you set realistic expectations?
Understanding the learning curve and capital reality. - What should you do in Days 1–30?
Focusing on learning structure and paper trading. - Why choose one strategy and ignore the rest?
Avoiding “shiny object syndrome”. - How do you build a journal from day one?
Starting the habit of professional data collection. - What happens in Days 31–60?
Moving to small live size and focusing on process. - Why track metrics instead of P&L?
Valuing discipline over temporary profit. - How do you review and refine your strategy?
Using your 60-day data to make tweaks. - What are the consistency and scaling rules for Days 61–90?
Knowing when you are ready to increase size. - What are common beginner traps in each phase?
Avoiding the pitfalls that stop most people early. - How do you make risk management a habit?
Turning capital protection into a reflex. - How do you build daily discipline?
Sticking to the plan even when it’s difficult. - What milestones signal you are ready to scale?
The objective signs that you have “arrived” as a trader.
About the institute
About The Stock Educators
The Stock Educators (TSE) is a NISM certified stock market training institute located in Pitampura, Delhi. Founded by Hemant Sharma – a SEBI Registered Research Analyst with 10+ years of experience – TSE was built with one mission: to produce traders who are disciplined, skilled, and consistently profitable.


Expert-Led Learning
Learn directly from NISM-certified trainers and SEBI-registered analysts with real market experience.
Live Market Training
Live trading sessions in every batch with real markets and real-money mindset.
Personalized Mentorship
Small batch sizes ensure individual attention, interactive learning, and continuous mentor support.
Our Stock Market Courses Pick Your Path


Compare All Programs
Compare All Programs
An easy-to-use curriculum comparison tool to help you select the specific trading path that aligns with your financial goals and risk profile.
What Makes The Stock Educators Different?
No. 1
Live Trading Sessions
Map current workflows and tools
Identify key friction points
Align on real team needs before building
No. 1
Live Trading Sessions
Map current workflows and tools
Identify key friction points
Align on real team needs before building
No. 1
Live Trading Sessions
Map current workflows and tools
Identify key friction points
Align on real team needs before building
No. 1
Live Trading Sessions
Map current workflows and tools
Identify key friction points
Align on real team needs before building
No. 1
Live Trading Sessions
Map current workflows and tools
Identify key friction points
Align on real team needs before building
No. 1
Live Trading Sessions
Map current workflows and tools
Identify key friction points
Align on real team needs before building
No. 1
Live Trading Sessions
Map current workflows and tools
Identify key friction points
Align on real team needs before building
No. 1
Live Trading Sessions
Map current workflows and tools
Identify key friction points
Align on real team needs before building
Live Trading Sessions
Every class includes live market analysis. You see real trades, real setups, and real risk management - not simulated examples.
NISM Certification
All programs prepare you for NISM certification, mandatory for stock brokers, research analysts, and investment advisors.
Mentorship-Based Learning
Small batch sizes mean real one-on-one attention. Your mentor reviews your trades, corrects mistakes, and helps you grow.
Paper Trading Practice
Before risking real capital, students practice with a trading simulator and paper trading to build confidence.
Placement & Career Support
TSE connects students with placement partners. Career paths include research analyst, stock broker, trader, and advisor.
Online + Offline Options
Study at our Pitampura Delhi center or join live online sessions from anywhere in India with the same mentor support.
Is This Course Right for You?
Working Professionals
Offers weekend and evening classes to accommodate busy work schedules.
Designed specifically for individuals with limited time during market hours.
Provides the tools to manage investments alongside a full-time job.
Existing Investors
Transition from basic mutual funds to direct equity investments.
Learn to manage your own capital rather than relying solely on third-party funds.
Focus on high-level tactics to increase existing investment returns.
Complete Beginners
Starts with the fundamental concepts of how the market works.
Progresses systematically into high-level trading techniques.
Offers a structured path for those with no prior background in finance.
Business Owners
Integrated approach to managing individual financial health.
Learn how to invest in ways that optimize tax liabilities.
Tailored advice for diversifying business profits into the financial markets.
Housewives
Empower yourself to become self-reliant and financially secure through trading.
Build a rewarding skill and execute trades effectively from the comfort of your house.
Discover how to intelligently invest and grow household savings.
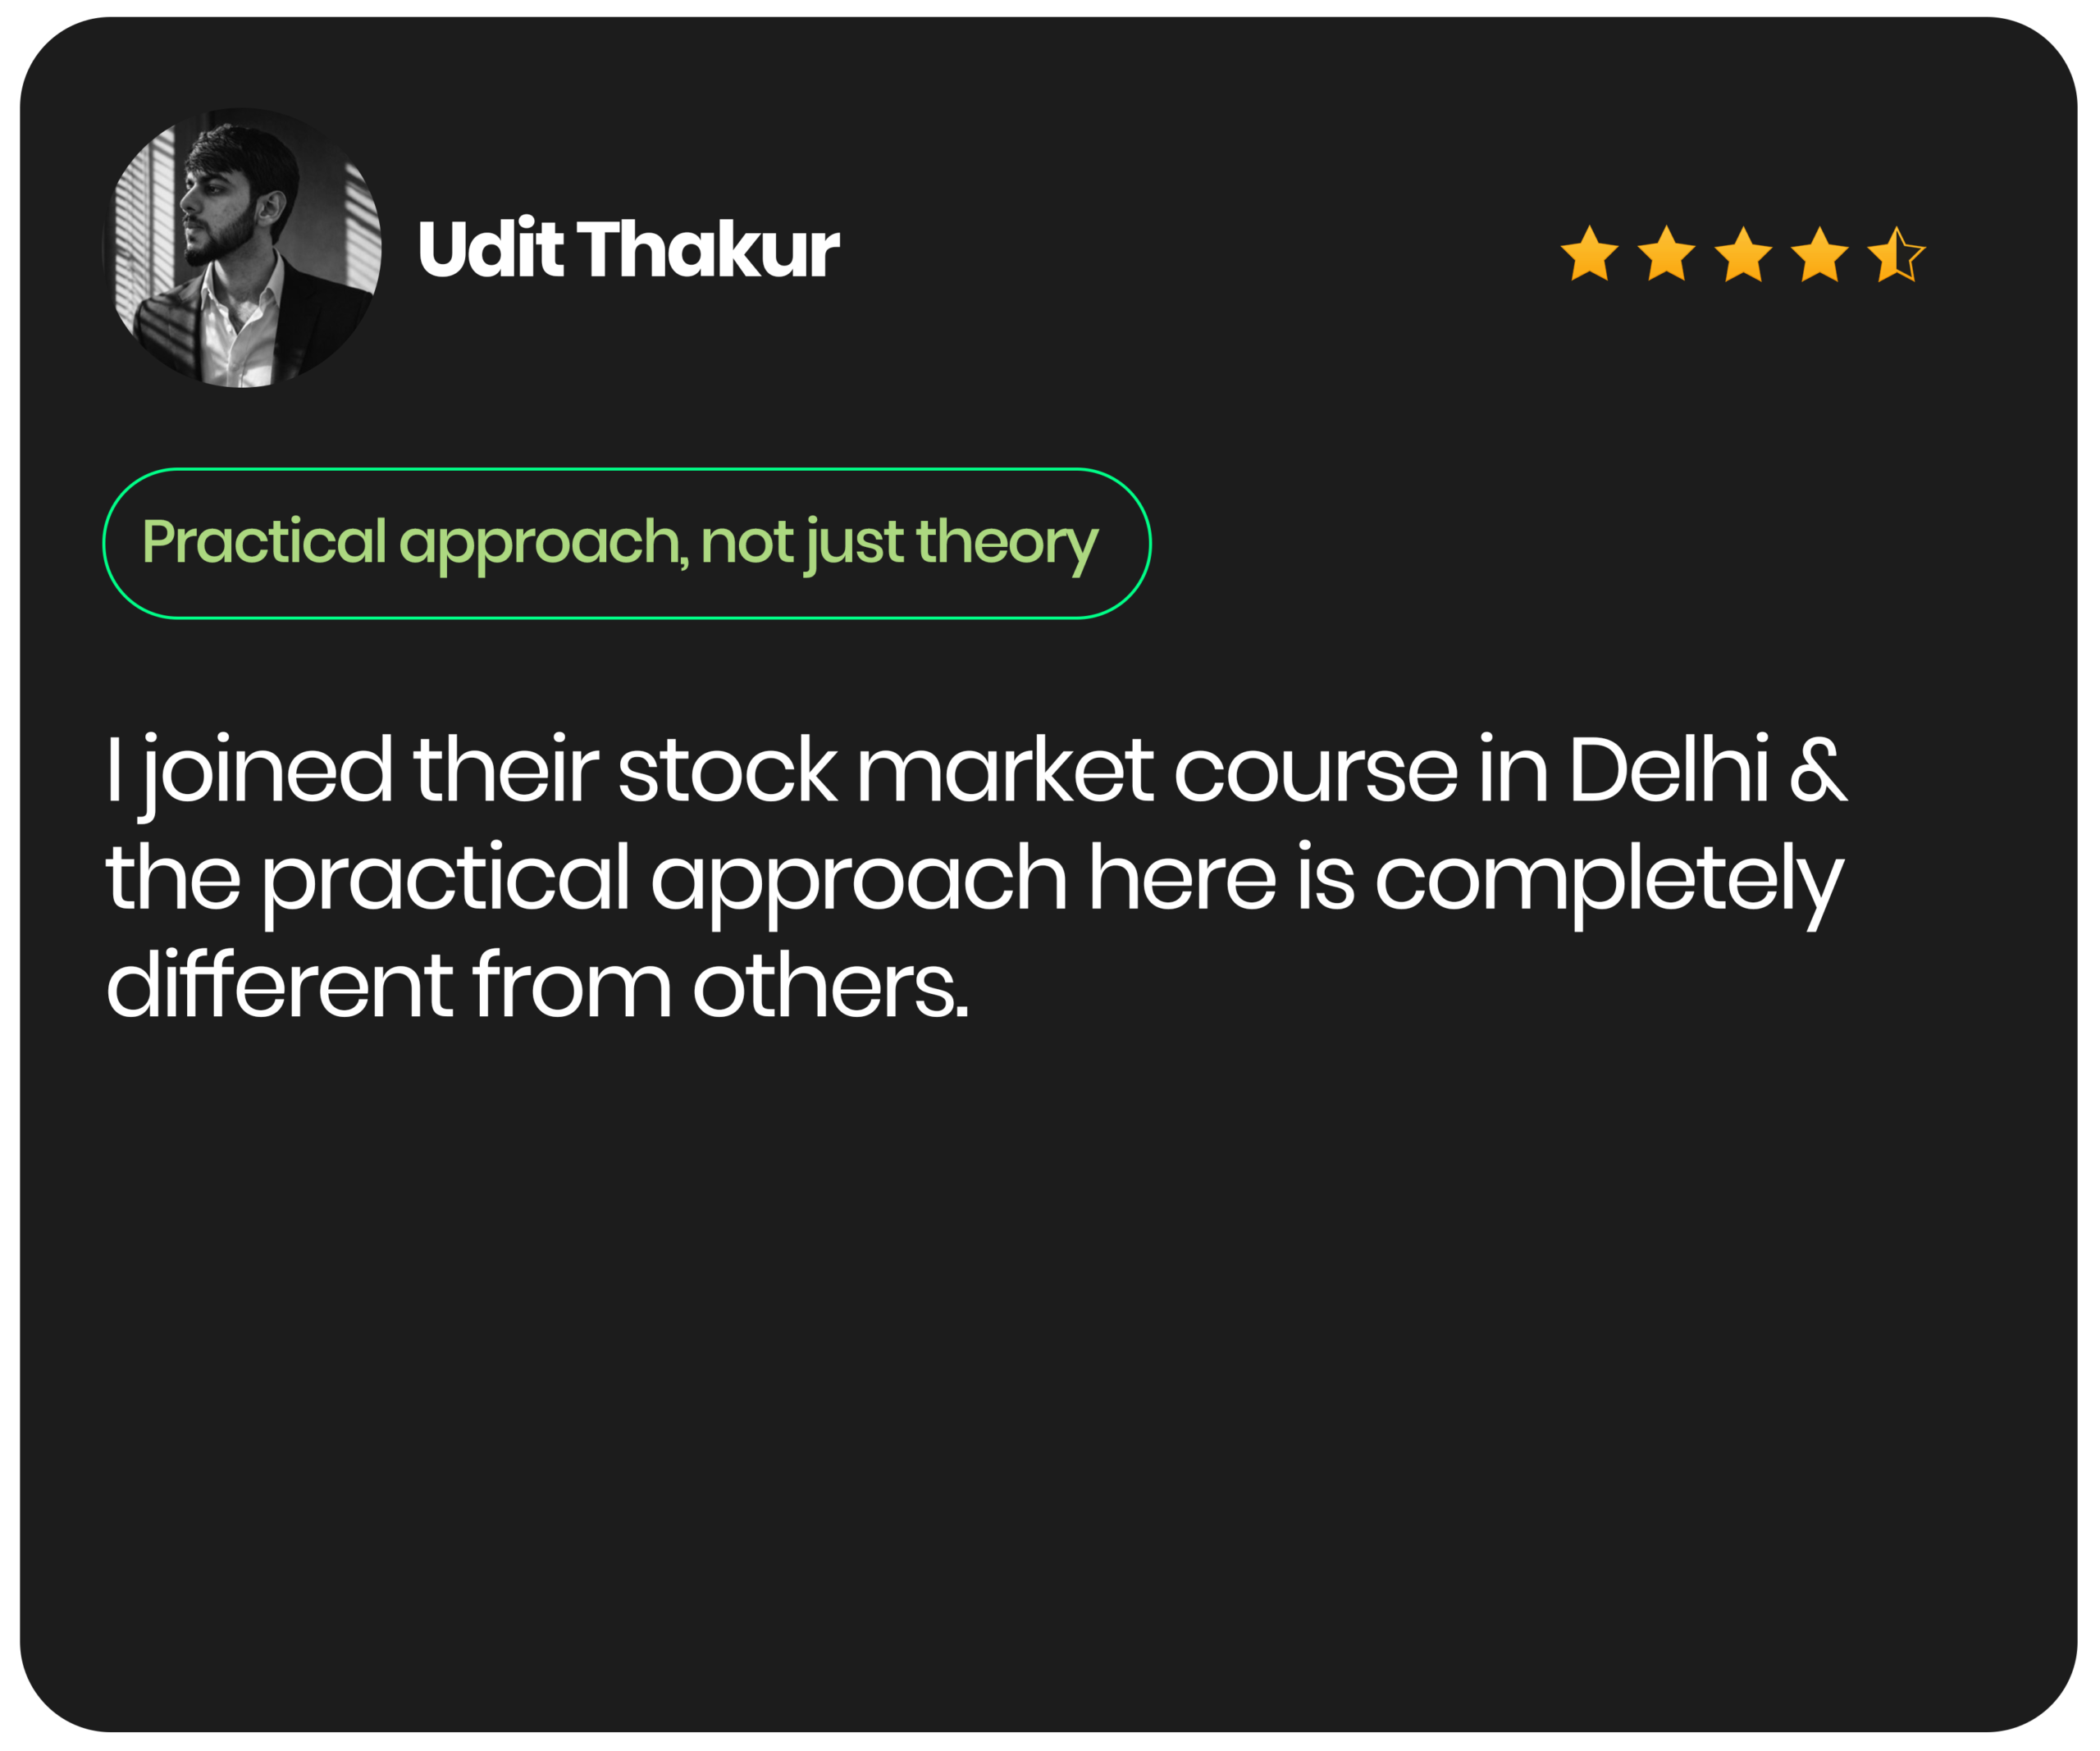
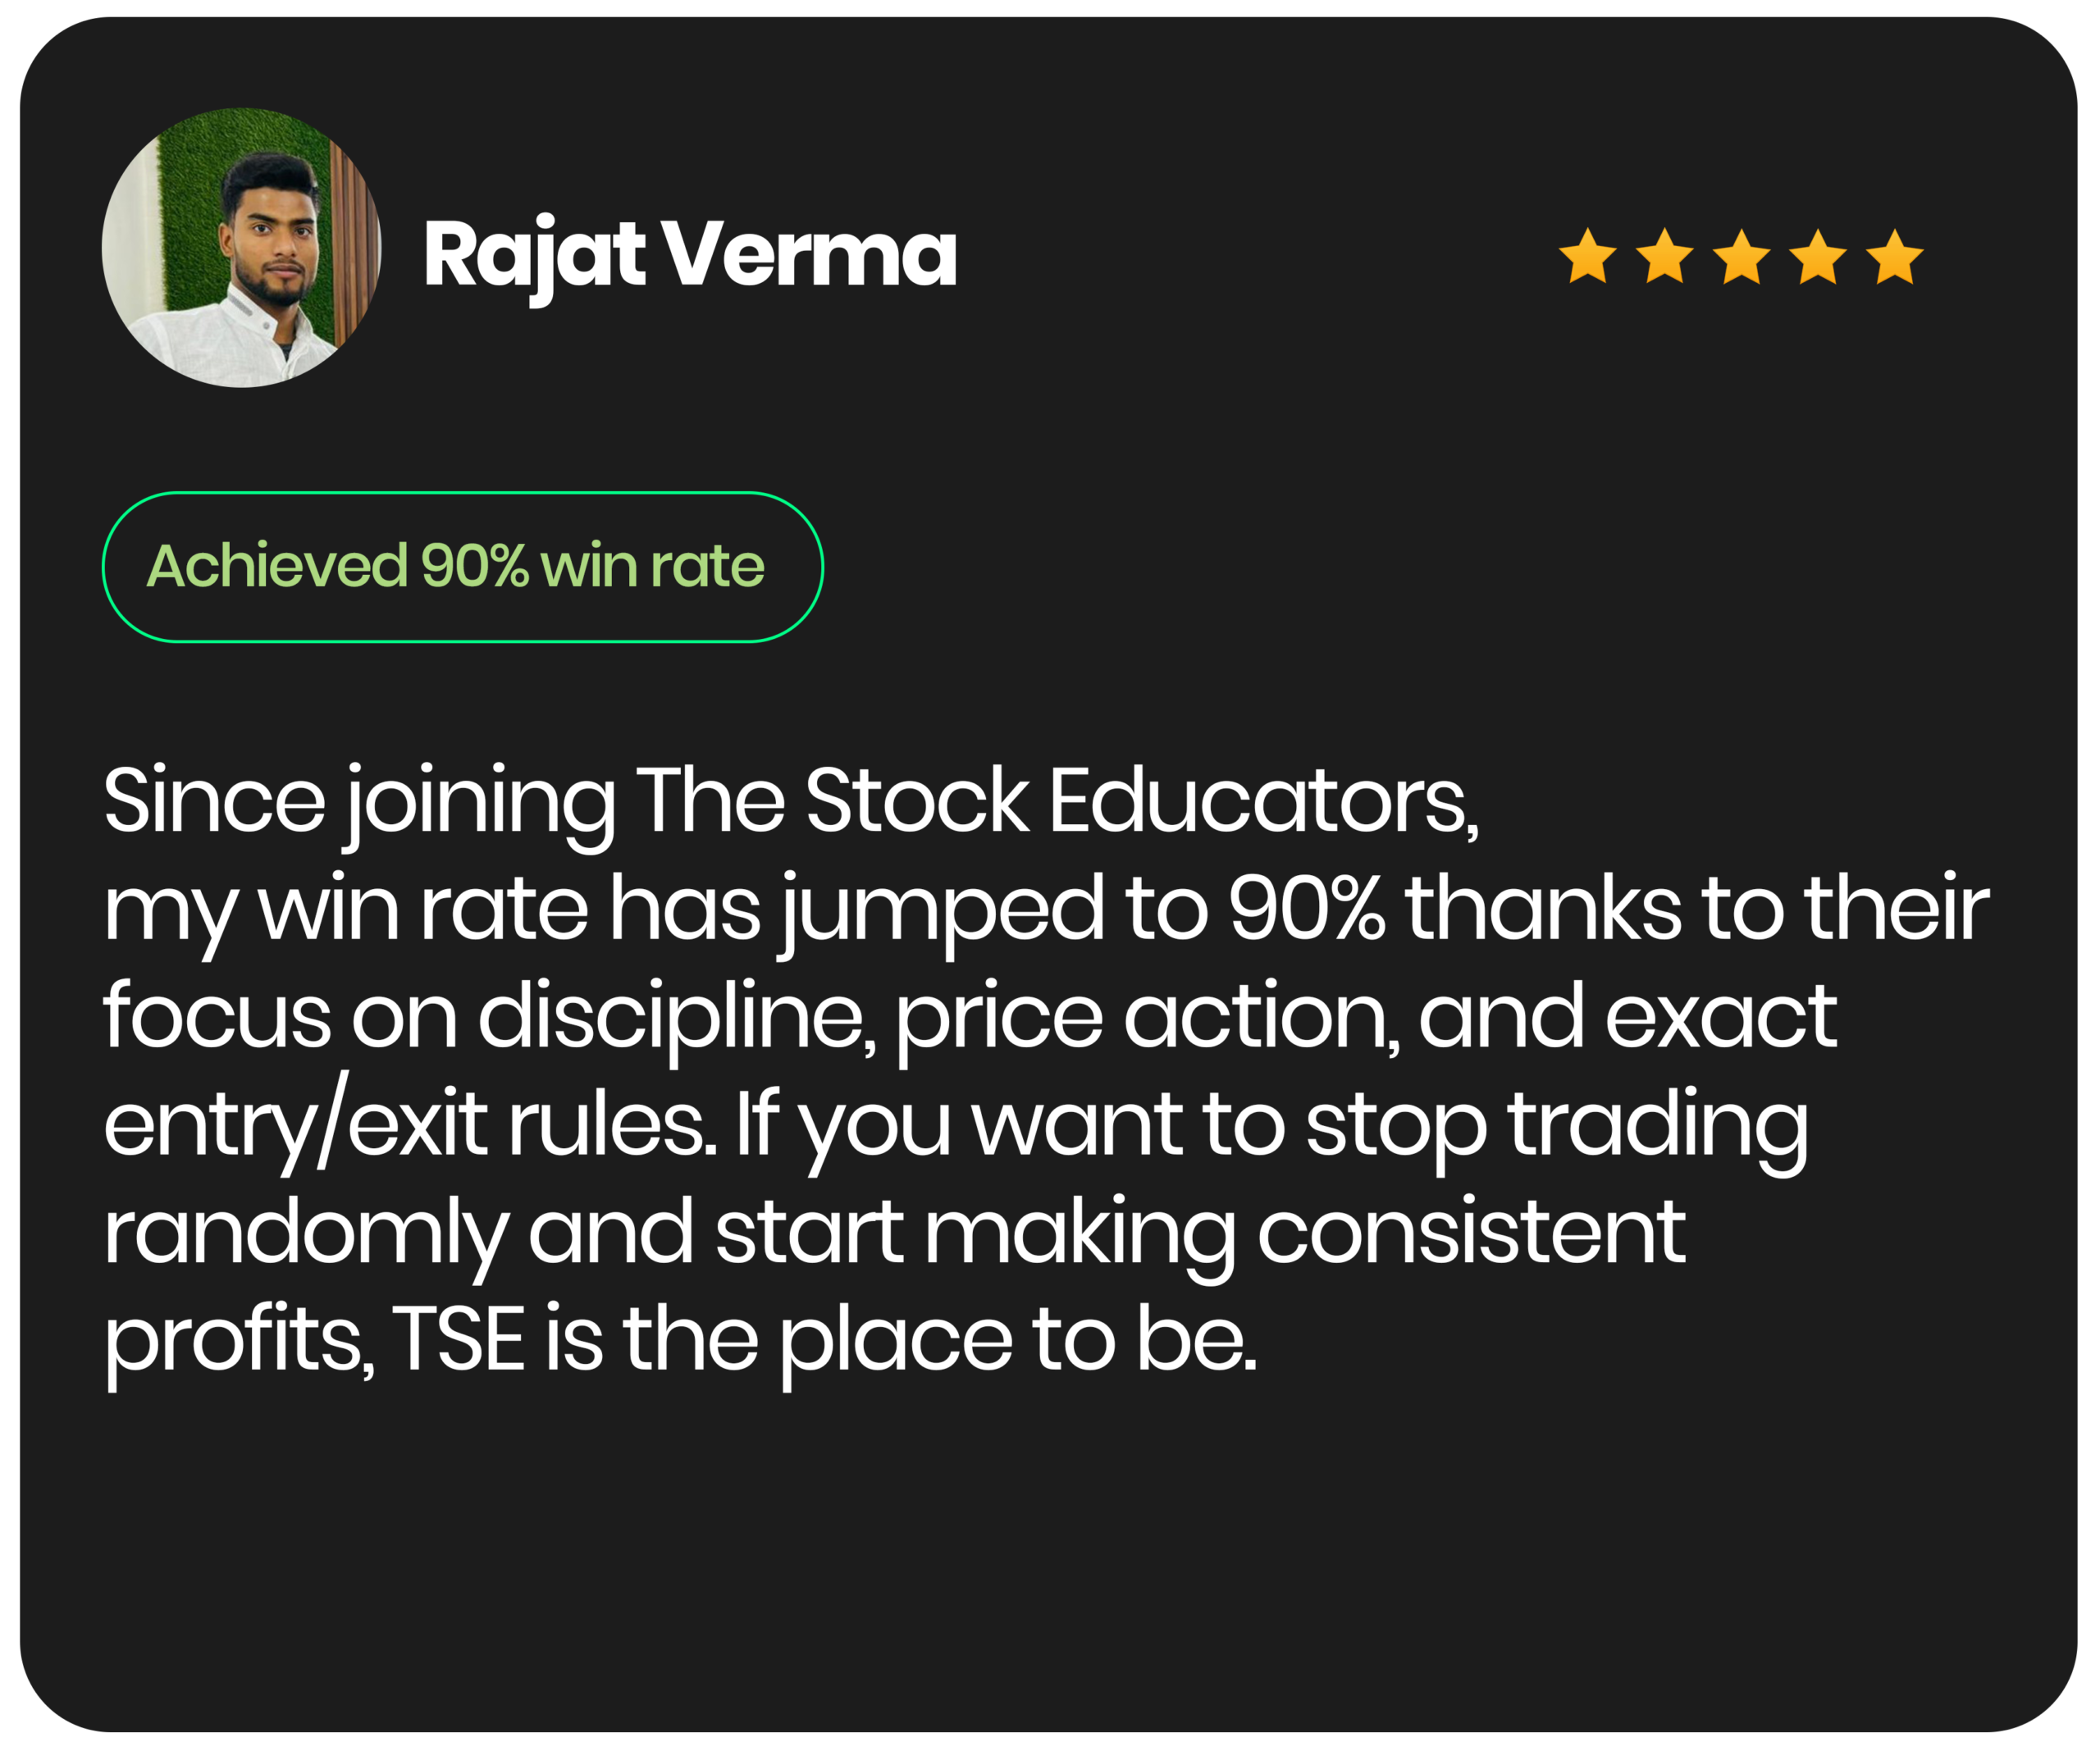
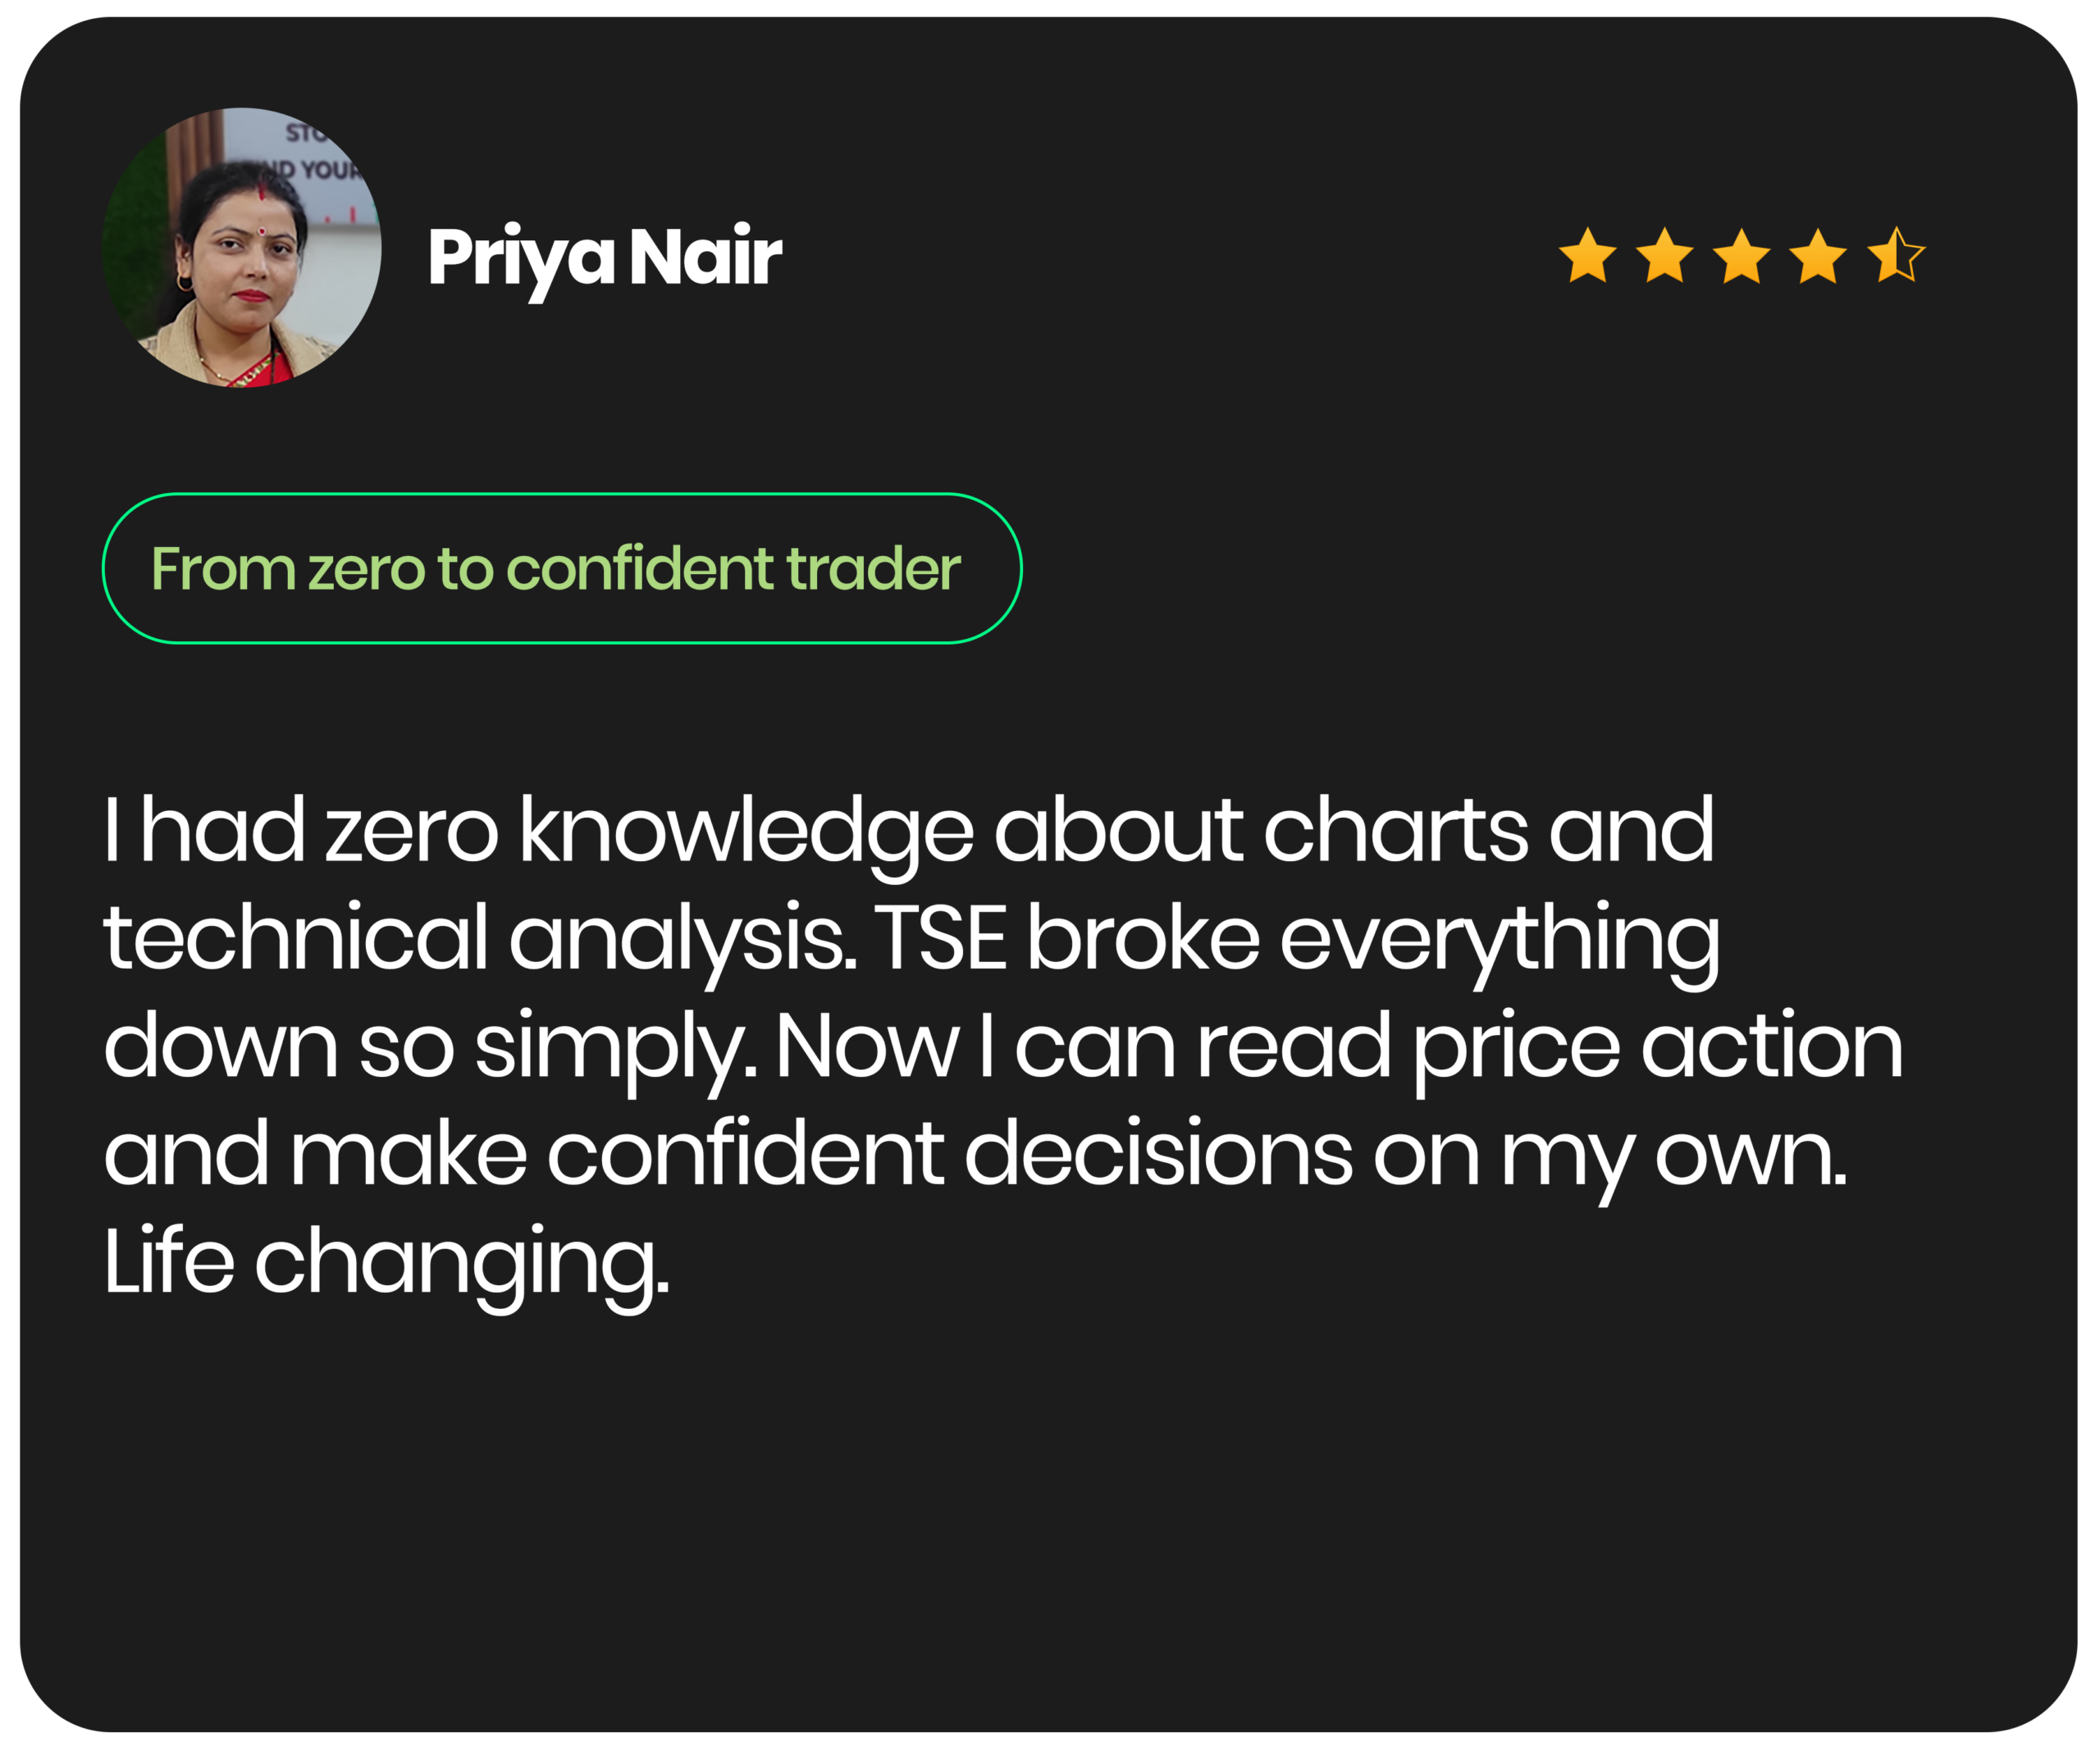
Student Success Story
Real Results from Real Students


Diploma, Certification, Degree and Preparation For
Prepare for India’s most respected financial market certifications with expert-led training and real market practice


_Limited.svg")

Frequently Asked Questions
1. I am new to F&O. Is the Option Mastery Course suitable for beginners?
Absolutely. We don’t rush into complex trades. The course starts from the absolute basics in Module 1, explaining exactly what derivatives are, why options exist, and the mechanical differences between calls and puts. Whether you are a complete beginner or struggling with consistency, we build your foundation before moving to advanced concepts.
2. Does this program focus on Option Buying or Option Selling?
We teach both, but with complete transparency. Early in the course, we cover the honest reality of option buying versus option selling so you have realistic expectations. You will learn directional buying (long calls/puts) as well as directional selling and income-generating strategies like covered calls and cash-secured puts.
3. Options trading is considered risky. How do you teach risk?
Survival in the market comes first. We have a dedicated “survival module” on Day 7 that covers risk per trade, position sizing, and the difference between defined-risk and undefined-risk trades. We also teach you how to handle margin requirements (SPAN + exposure) and protect your capital from gap or black-swan risks.
4. What if the market moves against my trade? Do you teach option adjustments?
Yes, and we don’t save it for the very end of the course! Adjustment techniques are taught right alongside short-premium strategies like straddles and strangles when you actually need them. You will learn exactly how to defend a losing position, including how to roll and manage an Iron Condor.
5. Will I learn how to read charts and technical analysis in this course?
Definitely. You don’t need to buy a separate technical analysis course. Modules 4 and 5 extensively cover pure price action, Dow Theory, support/resistance, and candlestick chart patterns. More importantly, we teach “critical framing” ensuring you only trade these candlestick patterns at key levels with volume confirmation, rather than in a vacuum.
6. I struggle with the Option Greeks (Delta, Theta, etc.). Are they covered in detail?
The Greeks are so important that we split them across two full days so no single class feels overloaded. You will build a deep intuition for how Delta affects direction, how Gamma changes your exposure, and how Theta (time decay) acts as the buyer’s enemy but the seller’s income.
7. Does the course include intraday trading strategies?
Yes, Module 9 provides specific, scenario-based playbooks specifically for intraday traders. We will teach you exactly how to read and execute trades during gap-up, gap-down, and flat or range-bound market openings. Every single setup is rigorously backtested on historical sessions during the class.
8. I am a working professional. Are there strategies for passive income?
For those who can’t watch the screen all day, Day 21 is entirely focused on a Delta-Neutral Monthly Strategy. We teach you how to build a monthly position step-by-step, re-hedge as the underlying asset moves, and capture time decay (Theta) safely while managing your margin.
9. Is there any live market practice, or is it mostly theory?
Theory is just the beginning. Days 25 to 29 of the curriculum are exclusively dedicated to Practical and Live Trading. You will apply everything you’ve learned from reading the NSE option chain to executing vertical spreads in real-time, live market conditions.
10. What happens at the end of the 30-day program?
On Capstone and Graduation day (Day 30), every student presents a backtested strategy complete with written risk rules and a reviewed trade journal. You won’t leave empty-handed; you will walk away with your own personalized trading plan, fully reviewed and officially signed off by us.