You found a fantastic company. The stores are packed, the products are flying off the shelves, and everyone on financial television is talking about their latest quarterly earnings report. Naturally, you open your brokerage app to buy some shares. But then you pause. Your finger hovers over the buy button.
Is the stock actually cheap right now, or are you about to wildly overpay for the hype?
This is the exact dilemma that paralyzes millions of retail investors. How do you actually know what a business is fundamentally worth? You look at the share price. Let’s say the ticker reads ₹500. Does that mean it’s a bargain? Not necessarily. A ₹500 stock could be incredibly expensive, and a ₹5,000 stock could be the absolute bargain of the decade. Share price alone tells you absolutely nothing. You need a mechanism to weigh the physical price against the actual money the company generates.
You need to master the pe ratio.
The Bottom Line:
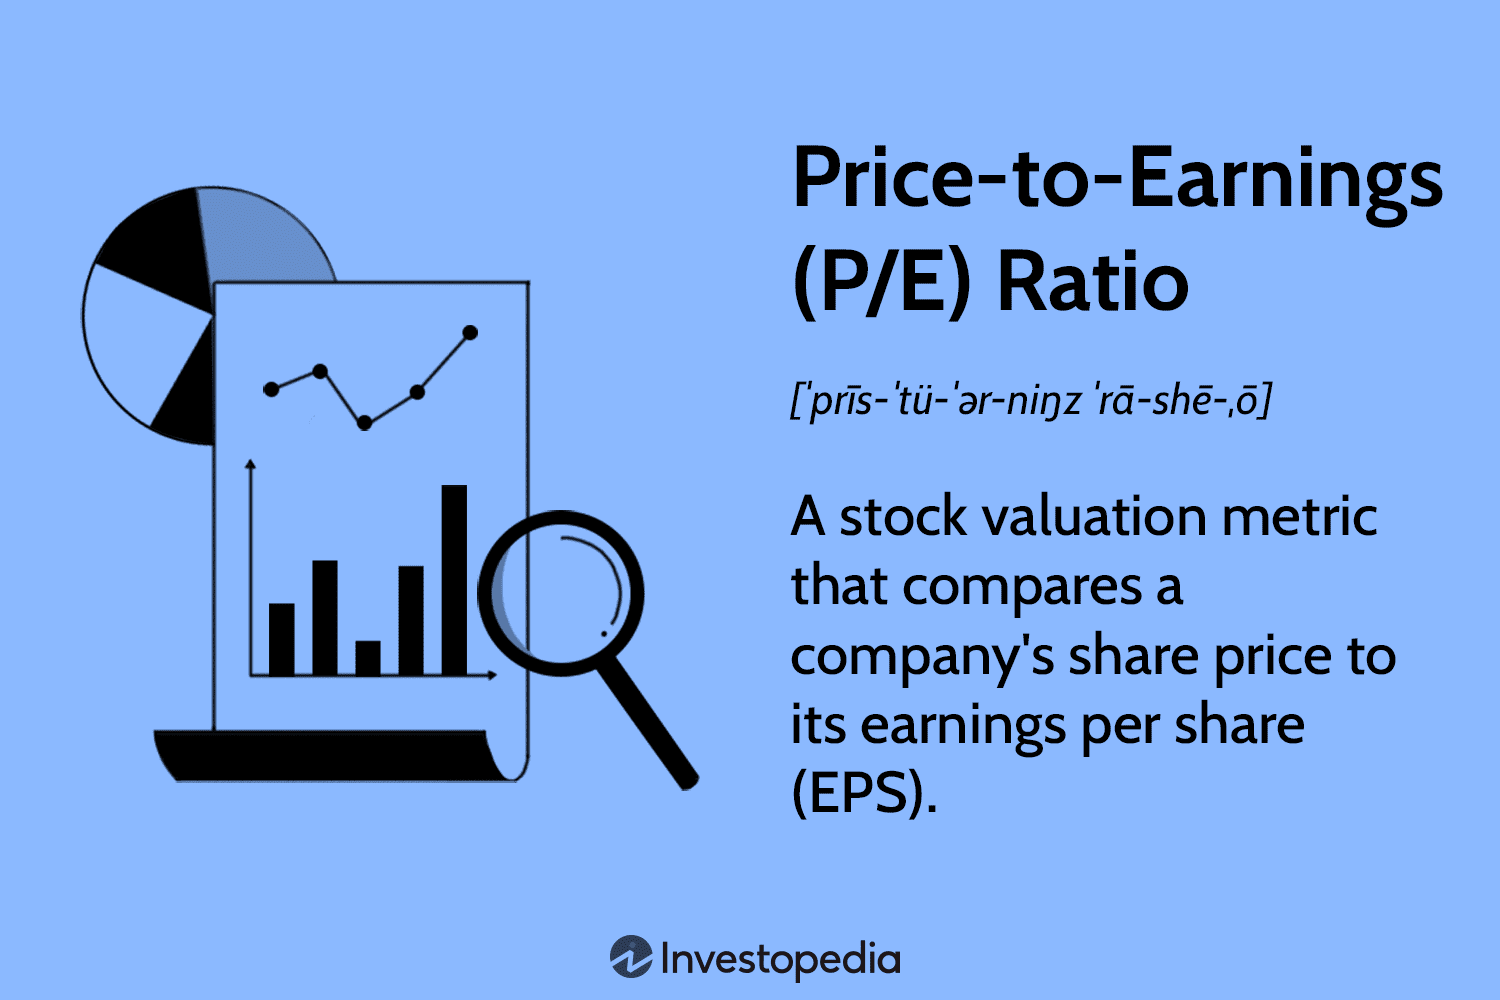
What is the pe ratio? It stands for the Price-to-Earnings ratio. It is a mathematical valuation metric that divides a company’s current share price by its earnings per share (EPS). Essentially, the pe ratio tells you exactly how many rupees you are paying for every single rupee of profit the company generates. A high number often suggests the stock is overvalued or priced for massive growth, while a lower number might indicate an undervalued, defensive bargain.
Unpacking the Mathematical Formula
Let’s break down the math. Do not let financial terminology intimidate you. This is elementary school arithmetic.
To calculate this metric, you only need two distinct numbers. First, the current market price of one single share. Second, the Earnings Per Share (EPS). You find the EPS by taking the company’s total net profit over the last twelve months and dividing it by the total number of outstanding shares.
Divide the share price by the EPS. That’s the entire process.
If a dominant FMCG company trades at ₹1,000 per share and generates an EPS of ₹50, the pe ratio is exactly 20.
What does that 20 actually mean in plain, actionable English? It means retail and institutional investors are currently willing to pay ₹20 for every ₹1 of profit the business produces. Another way to conceptualize it is through the lens of time. If corporate earnings stay exactly flat and never grow, it would theoretically take 20 years for the company to earn back your initial investment amount.
For a highly academic breakdown of this specific formula and its historical context, Investopedia’s detailed guide on the price-to-earnings valuation is a phenomenal resource to keep bookmarked.
The Illusion: Undervalued vs. Overvalued Stocks
This is the exact moment where things get tricky. Beginners consistently assume a low pe ratio automatically means a stock is a screaming buy. They see a metric of 8 and think the company is on sale.
Sometimes, that is true. Sometimes, you have found a hidden financial gem the broader market has unfairly punished.
But quite often, a rock-bottom pe ratio is a massive warning siren. It’s what seasoned Wall Street veterans call a “value trap.” The market might be pricing the stock cheaply because the underlying business is bleeding. Perhaps their core product is becoming obsolete. Perhaps they are drowning in toxic debt. The price is low because smart institutional money knows the corporate earnings are about to collapse.
Conversely, a high pe ratio doesn’t automatically mean a stock is a terrible, toxic investment.
Look at high-growth technology companies or renewable energy startups. They frequently trade at a pe ratio of 60, 80, or even 100. Why on earth would anyone pay ₹100 for just ₹1 of current profit? Because they aren’t buying the current profit. They are buying the future trajectory. They firmly believe the company’s earnings are going to violently explode upward over the next five years.
You are paying a premium for aggressive, future growth.
The Golden Rule: Industry Peer Comparison
If you only take away one conceptual framework from this guide, make it this: you must never analyze a pe ratio in total isolation. It is a relative metric, not an absolute truth.
Comparing the valuation of a software startup to a massive, slow-moving steel manufacturer is entirely useless. They operate in completely different economic universes. They possess wildly different profit margins, raw capital requirements, and growth trajectories.
To use the pe ratio correctly, you must compare apples to apples.
If you are evaluating a private banking stock, you must compare its pe ratio strictly against other leading private banks. You also need to zoom out and look at the broader sector average. If the banking sector average is 15, and your specific target bank has a pe ratio of 25, you have to ask yourself a very hard question. Why is this specific bank so much more expensive than its direct rivals?
Do they possess vastly superior digital technology? Do they have a drastically cleaner loan book? Are they expanding into rural markets faster? If you cannot justify the premium with hard data, you are likely overpaying for the asset.
You can easily track these sector-specific averages and historical index valuations using official market data sourced directly from the National Stock Exchange (NSE) indices reports.
Trailing vs. Forward Metrics: Looking Ahead
The stock market is a forward-looking machine. It generally doesn’t care about what happened yesterday. It only cares about what will happen tomorrow.
When you look up a stock on a standard financial website, the default pe ratio displayed is almost always the “Trailing” ratio. This utilizes the verified earnings from the past twelve months. It is concrete, audited data. But past performance does not pay your future dividends.
Professional operators overwhelmingly prefer to look at the “Forward” pe ratio.
This advanced version divides the current stock price by the estimated earnings for the upcoming financial year. If a company is expected to rapidly increase its net profits, the forward pe ratio will be significantly lower than the trailing one. It makes a stock that looks dangerously expensive today suddenly appear quite reasonable for tomorrow.
However, forward estimates are exactly that—estimates. If the company severely misses those projections during a bad quarter, the stock will violently crash. You have to deeply evaluate how reliable management’s guidance historically is. Morningstar’s framework for equity valuation offers an excellent perspective on balancing historical data against forward-looking corporate risk. Additionally, knowing how to read official corporate filings via databases like the U.S. Securities and Exchange Commission (SEC) or India’s MCA portal is vital for verifying those future estimates.
The PEG Ratio: Upgrading Your Analysis
Because a high pe ratio can be completely justified by massive growth, analysts created a secondary metric to bridge the gap. It is called the PEG ratio (Price/Earnings-to-Growth).
To find this, you simply divide the company’s pe ratio by its expected earnings growth rate.
If a company has a pe ratio of 30, but its earnings are growing at 30% per year, the PEG ratio is exactly 1.0. A PEG ratio of 1.0 is generally considered fairly valued. If the PEG is below 1.0, the stock might be severely undervalued relative to its massive growth potential.
This upgraded metric allows you to easily compare a slow-growing dividend stock against a hyper-growth tech company on a mathematically level playing field.
Integrating Valuation with a Complete Strategy
Relying entirely on a single fundamental metric to build your financial portfolio is dangerous. The pe ratio is just one single diagnostic tool in a massive analytical toolkit.
A company might look fundamentally incredibly cheap. But if the broader macroeconomic market is in a vicious, terrifying downtrend, that stock will still bleed capital. You cannot ignore market momentum. You need to combine fundamental valuation with a rigid understanding of market timing.
This is exactly where a practical beginner’s guide to technical analysis becomes your absolute best friend. Technical analysis allows you to read the immediate supply and demand footprints directly on a chart. It helps you pinpoint exactly when the heavy institutional money is finally stepping in to buy that undervalued, low pe ratio company.
Furthermore, discovering a great value stock means absolutely nothing if you violently mismanage your account sizing. Finding a cheap company and then dumping 80% of your total net worth into it is not investing. It is reckless gambling. You must construct a defensive, mathematical perimeter around your capital.
Immersing yourself in the strict principles of how to manage risk in the stock market will fundamentally save your entire portfolio from catastrophic drawdowns when your value thesis is occasionally wrong.
The Path to Professional Execution
The financial markets are utterly ruthless to the uneducated participant. You simply cannot survive by blindly guessing or following viral internet stock tips.
Understanding the mechanics of the pe ratio instantly elevates you above the average retail amateur. You stop blindly chasing flashing green charts. You start analyzing underlying businesses like an actual, rational corporate owner. You hunt for mispriced assets. You wait patiently for the market to panic and offer you a massive discount.
But navigating this psychological transition alone is incredibly frustrating. The gap between reading theoretical concepts online and executing them flawlessly under live market pressure is massive.
If you are truly serious about accelerating your financial competence, you need a heavily structured environment. You need a linear roadmap that removes the guesswork. Following a highly rigid 8-week plan to learn stock trading bridges that exact gap. It forces you to actively build mechanical habits before your life savings are exposed to danger.
Additionally, seeking out active, in-person mentorship changes the game completely. Find operators who actually trade live capital and prioritize capital defense over flashy, unrealistic returns. Exploring reliable trading academies in your area gives you access to the kind of unvarnished, battle-tested feedback you simply cannot get from reading a textbook.
The market will always be there tomorrow. Stop rushing. Take the necessary time to understand the absolute intrinsic value of what you are buying. Master the pe ratio, respect your mathematical risk boundaries, and let the sheer, unstoppable power of compounded growth build your wealth.